Google Data Analytics Certificate
Summary
An end-to-end analytics project completed as the capstone for the Google Data Analytics Professional Certificate. Using the IBM Telco Customer Churn dataset as a proxy for a recurring revenue SaaS business, the project followed Google's six-phase framework: Ask, Prepare, Process, Analyse, Share, and Act. Work included data cleaning, structured analysis, dashboard creation, and stakeholder-focused recommendations.
The Challenge
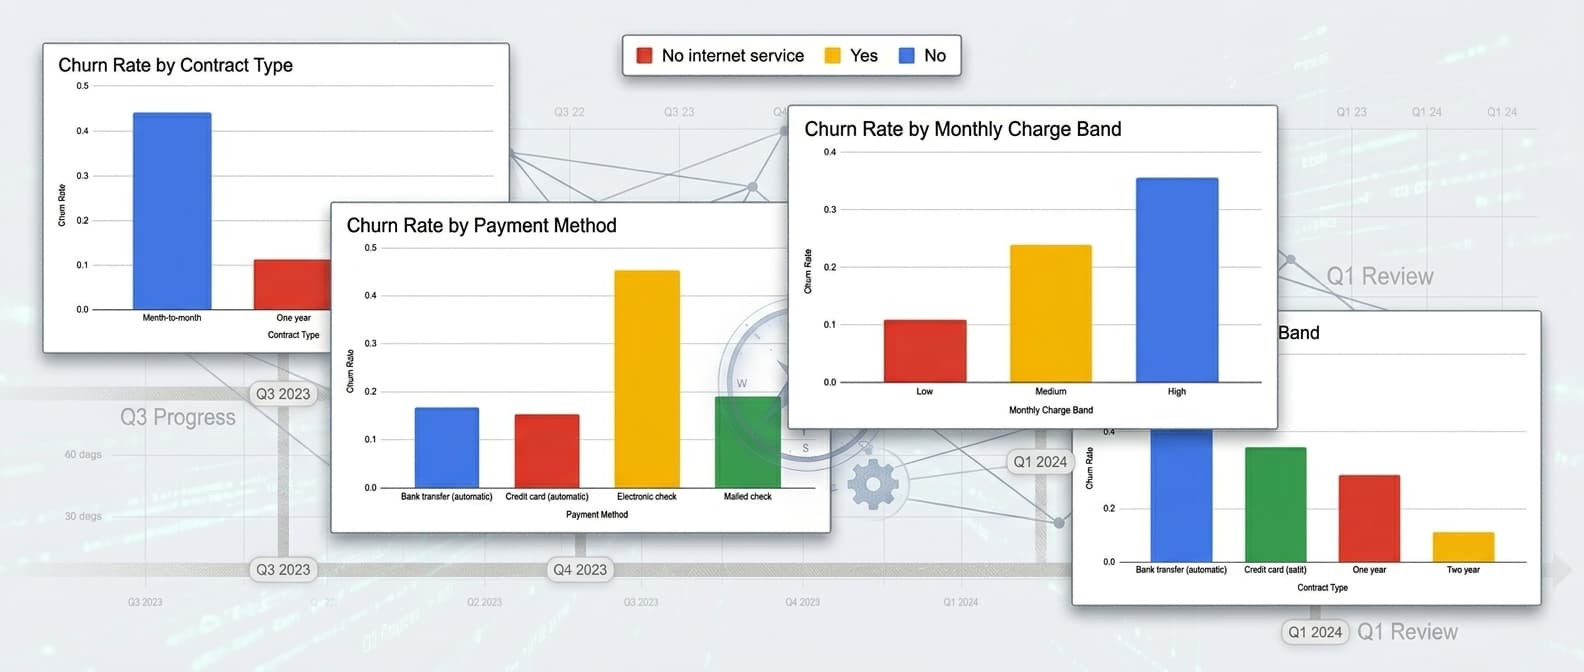
The objective was to identify why customers churn, which segments are highest risk, and where leadership should focus retention investment for fastest commercial impact. The broader challenge was converting raw customer behaviour data into clear business decisions relevant to Product, Growth, and Customer Success stakeholders.
Product Rationale
Commercial Analytics Application
Used a realistic subscription dataset to move beyond academic analysis and solve a commercially relevant recurring revenue problem centred on churn, retention, and lifetime value.
End-to-End Delivery
Completed the full workflow from data cleaning and segmentation analysis through to dashboard design, executive reporting, and prioritised recommendations for stakeholders.
Product Thinking
Focused on translating findings into practical actions such as onboarding improvements, contract conversion opportunities, and protecting high-value at-risk customers.
Tech Stack
Key Decisions
SaaS Proxy Framing: Positioned the telecom dataset as a SaaS-style subscription business because it reflects recurring billing, contract terms, onboarding risk, pricing sensitivity, and retention dynamics relevant to modern subscription models.
Action Over Description: Structured the final output around decisions leadership could act on immediately, rather than stopping at descriptive charts or surface-level observations.
Project Notes
No two projects solve the same problem, so each case study emphasises different aspects of delivery depending on what was most relevant to the challenge. Supporting visuals and implementation details are included here to provide additional context behind the final outcome.
Visuals
